
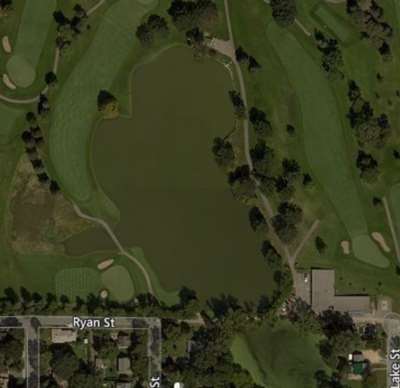
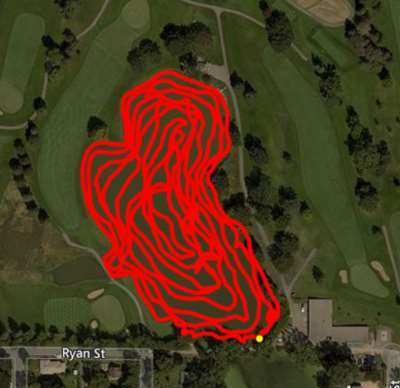
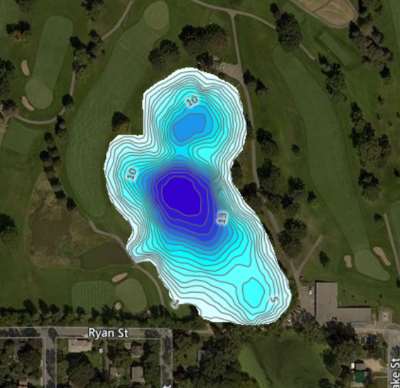
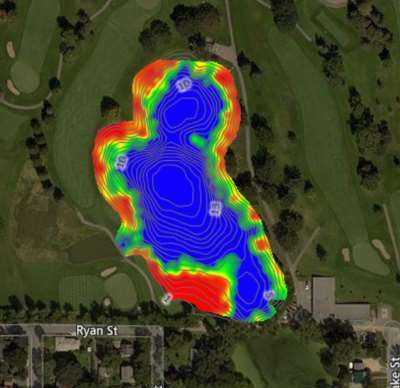
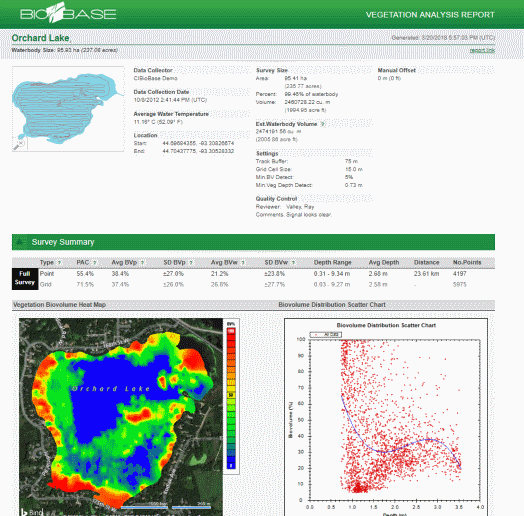
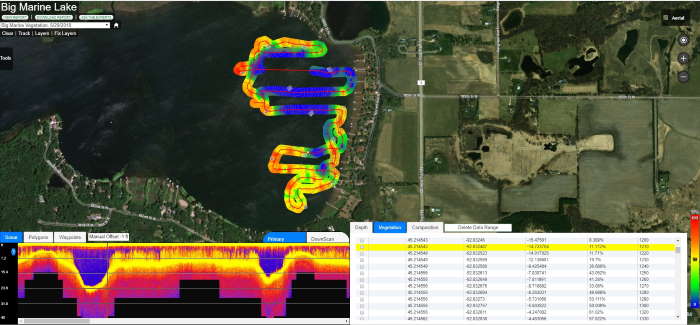
Record sonar and GPS passively from Lowrance or Simrad sonar and upload to BioBase cloud servers. Detailed GIS maps of depth, aquatic vegetation abundance, and bottom hardness are created automatically.
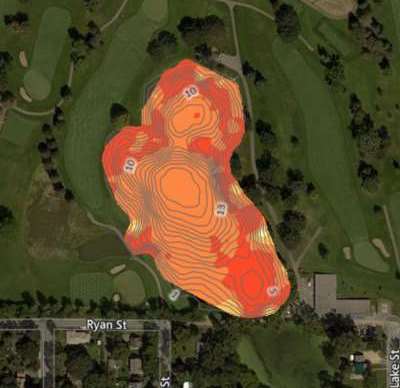
All interactive maps, processed data, and data reports are archived in an easy to browse dashboard.
Data reports are created automatically and available for sharing.
By the end of this project we were collecting [EcoSound] data via navigation of the point-intercept grids that allowed rapid and relatively passive whole-bay mapping of SAV in each bay
There is significant promise for resource managers to incorporate this [EcoSound] technology to generate large-scale, low-cost maps of SAV distribution and abundance through time
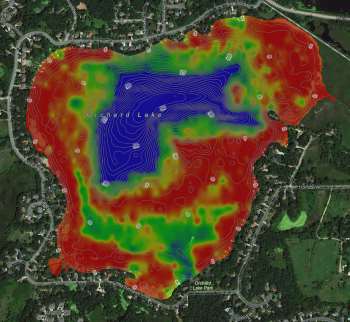
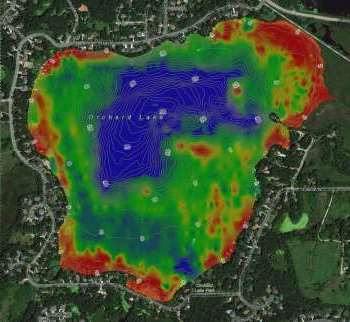
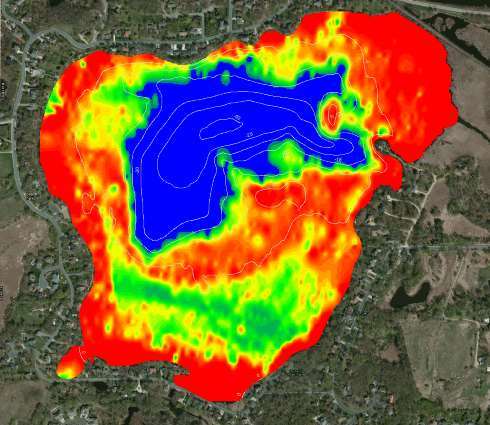
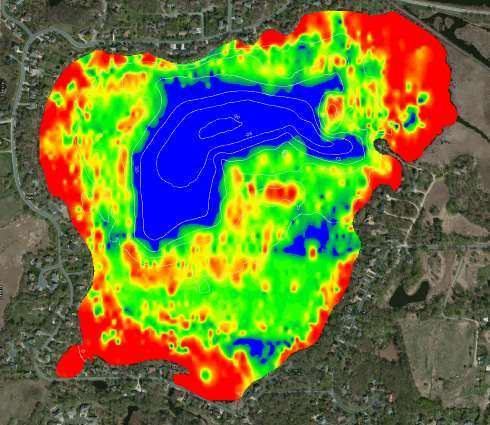
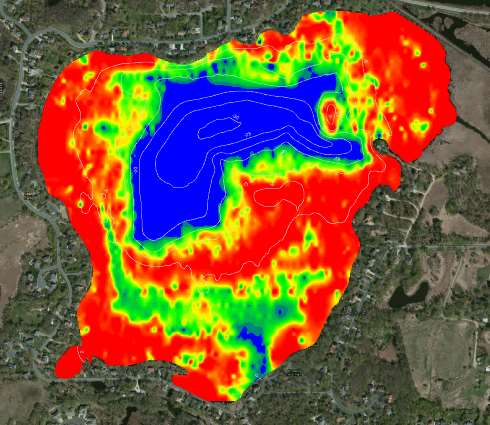
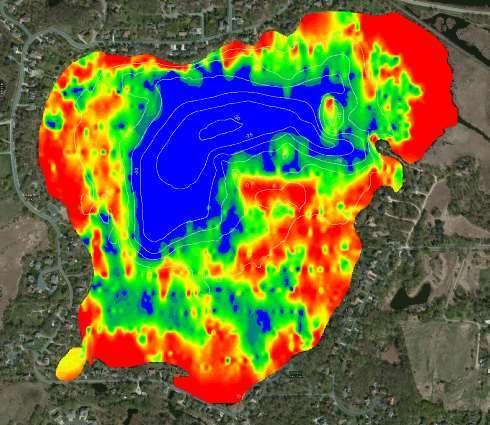
Monitor change in aquatic plant growth over time and the effects of invasive species.
View article published in the Journal of Aquatic Plant Management. View Article
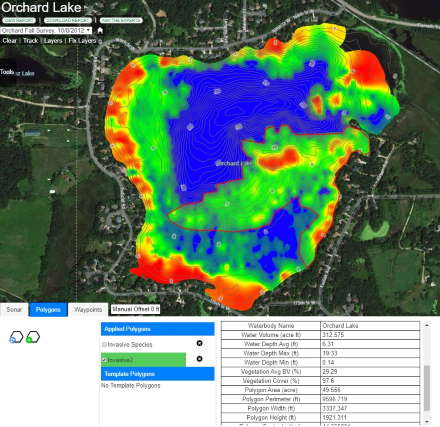
Create polygons around an area of interest and generate local statistics like water volume or aquatic vegetation cover; Export Polygon Data and Outlines to a GPS file.

Latest Updates & Advancements